Add money Find jobsWatch videosDocsBuild with AIExamplesUse casesFor agentsDaily storm leadsML Storm ForecastDataCompareStorm mapAPI AccessStorm Mailers Legacy log in Get an API key

The products behind these examples

Five products. One key.

Atlas United risk models for every U.S. address: address-level storm forecasts for the next 24 hours to 10 days, plus every reported storm near that address back to 2003. Pay per address, no contract.

AtlasCast, an Atlas United product

ML Storm Forecast by Address

Per address: structure replacement value in USD (replacement cost, not market value) and the estimated people there, plus the full address, forecast time, storm type, risk label and past storm reports.

$0.05 per address.

Atlas United

Model-Based Weather by Address

The free lean answer: temperature, dewpoint, humidity, wind speed, gust and direction, precipitation and type, pressure, visibility and alerts.

Free lean response.

Atlas United

Model-Based Hourly Forecast by Address

Temperature, dewpoint, humidity, wind, gust, precipitation, visibility, pressure, hail size, lightning rate and a tornado rotation score for the hour you ask about, about 40 core fields with details=true, plus forecast_hour_used and a forecast note.

$0.0002 per call with details=true.

TrueFixR

Storm History by Address: Reported and Radar-Detected Events Since 2003

A formatted report with a reference_id, one line per event, plus the summary view (hazard score, $0.50 per property): per category the event count, most recent date, years since the last event and, for hail, wind and winter, the most severe event.

$0.05 per event line, $10 minimum per report.

TrueFixR

Past Storm Leads by Address: Reported and Radar-Detected, Last 365 Days

Per address: full address, coordinates, storm type, event time, severity with its unit (such as hail inches or wind mph), distance from the event and a hit count for repeat exposure.

$0.05 per address.

Free previews on every product. Forecasts describe what could happen, not what will happen. Not affiliated with NOAA or the NWS.

1

A repair crew finds where storms were reported Counts free, 5 cents per address

BeforeYou drive around hoping to spot storm damage, or wait for the phone to ring.
AfterYou see how many addresses with a reported storm nearby in your county, free, then take the list.

Pick a county and a storm type. The count is free. The address list is 5 cents per address.

Copy, paste into ChatGPT or Claude
Using the TrueFixR storm API (https://data.truefixr.com/llms.txt), how many addresses had hail reported nearby in Dallas County, TX in the last 30 days? My key: YOUR_KEY

Paste it into ChatGPT or Claude, swap in your county and your key. Lists also come as CSV with &format=csv.

What you get: The number of addresses with storms reported nearby, how many had more than one, and the price of the list before you pay.

Other tools call this storm leads. See how it works.

2

An adjuster checks a date of loss Free

BeforeA customer says hail hit on May 28. You search weather sites for an hour and still are not sure.
AfterPaste one prompt. In seconds you know whether a storm was reported near the address that day.

One address, one date, one plain answer. Do it for a whole claims list by asking the AI to repeat it for each row.

Copy, paste into ChatGPT or Claude
Using the TrueFixR storm API (https://data.truefixr.com/llms.txt), my spreadsheet has an address and a date of loss on every claim. For each row, was a storm reported or radar-detected near that address on that date? Tell me the price first. My key: YOUR_KEY

Paste it into ChatGPT or Claude, swap in your address and your key.

More detail for your AI
Copy, paste into ChatGPT or Claude, press enter
I have a spreadsheet (CSV) with one row per insurance claim: a street address and the date the damage was reported (YYYY-MM-DD). Using the TrueFixR storm API (base URL https://data.truefixr.com). Docs: https://truefixr.com/docs.html . Free menu of everything the API can do: https://data.truefixr.com/v1/data . Technical spec: https://data.truefixr.com/openapi.json .
For each row call GET /v1/data?dataset=history&address=<address>&date_of_loss=<date>. The free preview returns a yes or no for whether storm events were reported or radar-detected near that address around that date. Write a script that adds that answer as a new column. Wait 1 second between calls. Make no paid calls: the full report costs real money, so if I want one, my API key is YOUR_KEY (I will replace YOUR_KEY myself; keep it in an environment variable, never inside the code) and you must show me the price and ask first. Say in the output that this is a weather record, not a damage finding. Explain how to run it step by step like I am not technical.

What you get: Your claims sheet back with a yes or no column, plus simple steps to run it.

Sample answer"Yes, within 5 miles. A severe-weather event is on file within 5 miles of this address on 2024-05-28. It depends on how close you need it: for this example, 1 mile = No, 5 miles = Yes. This is a weather record, not a damage finding, and not a claim the storm hit the address."

Other tools call this a date of loss report, or a claims report.

3

A business owner checks a property before a call Free

BeforeYou are about to quote a job and have no idea what storms the property has been through.
AfterOne prompt gives you a one-page storm summary you can read in a minute or hand to the customer.

A Storm History summary plus model-based weather for one address.

Copy, paste into ChatGPT or Claude
Using the TrueFixR storm API (https://data.truefixr.com/llms.txt), give me a one-page storm summary for 1500 Marilla St, Dallas, TX.

Paste it into ChatGPT or Claude, swap in your address and your key.

More detail for your AI
Copy, paste into ChatGPT or Claude, press enter
I want a one-page storm summary for a property. Please use the free TrueFixR storm data service (https://data.truefixr.com).
Open this link: https://data.truefixr.com/v1/data?dataset=hazard_score&address=1500%20Marilla%20St%2C%20Dallas%2C%20TX
It is a free preview and needs no key. Then take the latitude and longitude from the answer and open https://data.truefixr.com/v1/data?dataset=weather&lat=LAT&lon=LON (put the real numbers in) for the weather right now and any active severe alerts.
Write one short page I could hand to a customer: storm history by type, the weather right now, and any alerts. Use plain words. Say this is a record of storms near the address, not an inspection. Do not make any paid request.

What you get: A short page: storm history by type, weather right now, and any alerts.

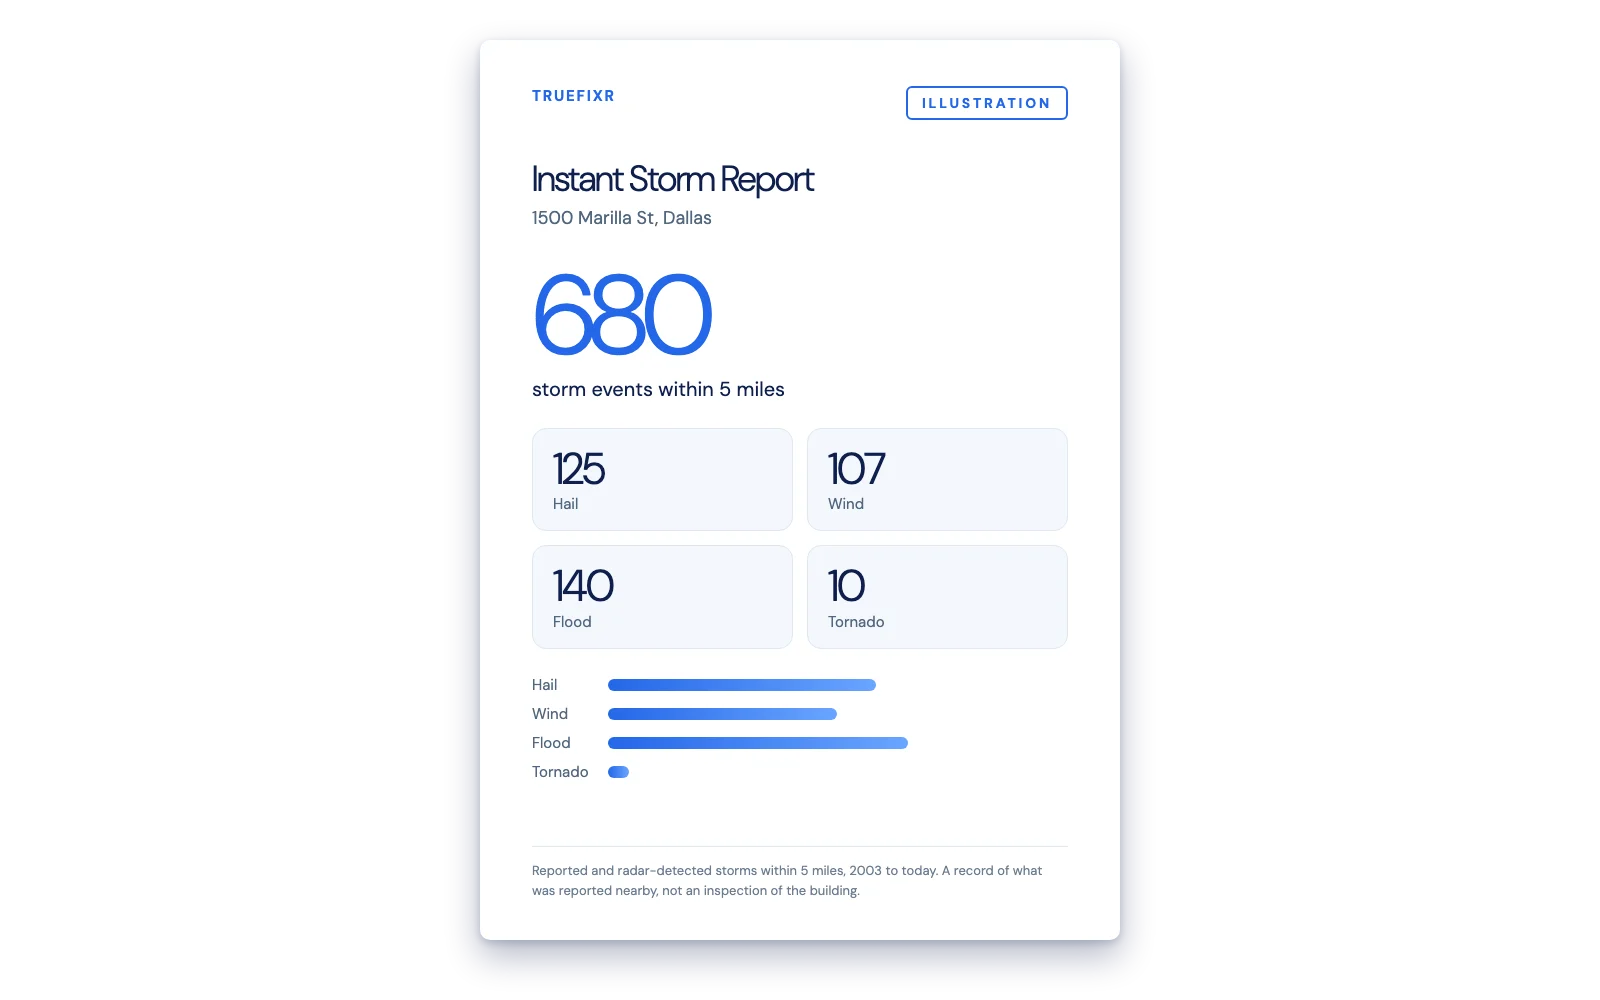
Sample answer"1500 Marilla St, Dallas: 680 storm events on record since 2003, including 125 hail, 107 wind and 140 flood. Right now there are no active alerts. This is a record of storms near the address, not an inspection."

Other tools call this a property storm report or hail history report.

4

A crew manager watches for storms today Free

BeforeYou check three weather apps every morning and still get surprised.
AfterOne list of your properties, and only the ones with active severe weather alerts show up.

Run it every 30 minutes and you only hear about the places that matter.

Copy, paste into ChatGPT or Claude
Using the TrueFixR storm API (https://data.truefixr.com/llms.txt), check Model-Based Weather by Address and any active severe alerts for each map point on my list (latitude and longitude).

Paste it into ChatGPT or Claude, swap in your address and your key.

More detail for your AI
Copy, paste into ChatGPT or Claude, press enter
I have a list of properties as map points (latitude and longitude, for example 32.78 and -96.80 is downtown Dallas). If I only have street addresses, tell me a free way to look up the points. Using the TrueFixR storm API (base URL https://data.truefixr.com). Docs: https://truefixr.com/docs.html . Free menu of everything the API can do: https://data.truefixr.com/v1/data . Technical spec: https://data.truefixr.com/openapi.json .
For each point call GET /v1/data?dataset=weather&lat=<lat>&lon=<lon>. It is free and needs no key. The response has an alerts list for active severe weather alerts and a nowcast that says whether it is raining now. Write a script that prints only the properties that have at least one alert, and shows how to run it every 30 minutes on my computer. Explain every step like I am not technical. If a paid option is ever needed, my API key is YOUR_KEY (I replace it myself, never paste it in chat) and ask me before any paid call.

What you get: A short list of only the places with active alerts right now.

Sample answer"Checked 12 properties. None has an active severe weather alert right now." (On a stormy day it lists the places that do.)

Other tools call this storm tracking. You send the alert yourself.

5

A sales team calls customers before the storm 5 cents per address

BeforeYou find out about a storm when the phone rings, after your competitors already called.
AfterEach morning you get a short list of customers whose address a storm could reach, worst first. This is the county-level forecast status; address-level forecasts are ML Storm Forecast by Address.

It gives each place its county forecast status, A (low) to F (extreme). It says a storm could happen, not that it will.

Copy, paste into ChatGPT or Claude
Using the TrueFixR storm API (https://data.truefixr.com/llms.txt), every morning, tell me which customers on my list (label, lat, lon) a storm could reach. Use ML Storm Forecast by Address. My key: YOUR_KEY

Paste it into ChatGPT or Claude, swap in your address and your key.

More detail for your AI
Copy, paste into ChatGPT or Claude, press enter
I have a CSV of customers with columns label, lat, lon. Using the TrueFixR API, write a script I run each morning that tells me which customers a storm could reach. Base URL: https://data.truefixr.com. Docs: https://truefixr.com/docs.html . Free menu: https://data.truefixr.com/v1/data . Technical spec: https://data.truefixr.com/openapi.json .
Use POST /v1/portfolio/risk with body {"locations":[{"lat":30.27,"lon":-97.74,"label":"row name"}],"window":"24h"} and header Authorization: Bearer YOUR_KEY, 500 rows per call. It costs $0.05 per location, so build a dry run that prints the count and total price and only pays when I add --go. Print only customers in counties with status C, D or F, worst first. My API key is YOUR_KEY (I replace it myself, never paste it in chat; keep it in an environment variable). Forecast risk means a storm could happen, not that it will. Explain every step like I am not technical.

What you get: A short morning call list, after a dry run shows the cost.

Sample answer"I found 120 customers. Cost: 120 x $0.05 = $6.00. Nothing has been charged. Add --go to run it." After it runs: "Travis County, TX: county status C (elevated)."

Other tools call this a county-level storm forecast for a customer list.

6

An office manager adds storm info to the customer list Free

BeforeYour customer list says nothing about weather, so nobody knows who is most exposed.
AfterTwo new columns appear next to every customer: storm count and county forecast label.

Works on any spreadsheet that has a latitude and longitude for each row.

Copy, paste into ChatGPT or Claude
Using the TrueFixR storm API (https://data.truefixr.com/llms.txt), add two columns to my customer spreadsheet: storms on record nearby and the county forecast label A to F. Tell me the price first. My key: YOUR_KEY

Paste it into ChatGPT or Claude, swap in your address and your key.

More detail for your AI
Copy, paste into ChatGPT or Claude, press enter
I have a spreadsheet of customers with a latitude and longitude for each one. Please write me a small program that adds two columns: how many storm events are on record near each customer, and the county forecast label from A (low) to F (extreme). Use the free TrueFixR storm data service at https://data.truefixr.com . For each row open https://data.truefixr.com/v1/data?dataset=history&lat=LAT&lon=LON for the storm count and https://data.truefixr.com/v1/data?dataset=risk&lat=LAT&lon=LON for the county label. These previews are free and need no key. Wait 1 second between rows. Make no paid requests. If a paid request is ever needed, my key is YOUR_KEY (I will put in my real key myself, never ask me to paste it in this chat) and you must show me the price and ask first. Explain how to run it step by step, as if I am not technical, including how to install Python.

What you get: Your spreadsheet with a storm count and a county forecast label added to every row.

Sample answer"Dallas customer: 297 storm events on record, county label C. Charleston customer: 37 storm events on record, county label D."

Other tools call this property storm history added to a customer record.

7

Download your data, build your own report Free to preview

BeforeData locked in someone else's report format.
AfterA file you can drop into your own template.

Your data. Your template. Your brand. We sell the data, you design the report.

Copy, paste into ChatGPT or Claude
Using the TrueFixR storm API (https://data.truefixr.com/llms.txt), get the storm data for 1500 Marilla St, Dallas, TX as a file I can save, and fill it into my report template. My key: YOUR_KEY

Paste it into ChatGPT or Claude, swap in your address and your key.

What you get: A data file (JSON, or CSV for list pulls) to use in your own PDF, spreadsheet or app.

Other tools call this a custom storm history report.

Developer?

Want the code instead?

For developers: Python and JavaScript for each exampleCopy-paste scripts with the real responses. A sixth example shows an agent that pays per call. Open to see the code.
1

Date of loss report

Did a severe-weather event happen near this property on the day someone says it did? One call, a plain yes or no.

What other tools call this: a date of loss report, as used in claims.

GETdataset=historyFree preview, no key
Your appGET /v1/data?dataset=history
&lat=32.78&lon=-96.80
&date_of_loss=2024-05-28
TrueFixR APILooks for events near the point on that day
You get back
date_of_loss_supported: true

What you get back

{
  "dataset": "history",
  "radius_mi": 5.0,
  "date_of_loss": "2024-05-28",
  "date_of_loss_supported": true,
  "answer": "A severe-weather event is on file within 5.0 miles of this address on 2024-05-28.",
  "real_line_count": 686,
  "estimated_cost_usd": 34.3
}

Real response from the free preview. The full report (every event, all 11 reported-event categories, 2003 to present) is $0.05 per line, $10.00 minimum.

{
  "date_of_loss": "2024-05-29",
  "date_of_loss_supported": false,
  "answer": "No severe-weather event is on file within 5.0 miles of this address on 2024-05-29."
}

Same call, next day. Real response.

Copy and paste

python3 · requests
import sys, requests

lat, lon, day = sys.argv[1:4]
r = requests.get(
    "https://data.truefixr.com/v1/data",
    params={"dataset": "history", "lat": lat, "lon": lon, "date_of_loss": day},
    timeout=30,
)
r.raise_for_status()
d = r.json()

print("Supported:", d["date_of_loss_supported"])
print(d["answer"])
print("Full report would cost $%.2f (free to preview)" % d["estimated_cost_usd"])
Run it
terminal
python3 date_of_loss.py 32.78 -96.80 2024-05-28
# or: node date_of_loss.mjs 32.78 -96.80 2024-05-28
Supported: True
A severe-weather event is on file within 5.0 miles of this address on 2024-05-28.
Full report would cost $34.30 (free to preview)

Real output of the Python script against the live API.

2

County forecast status for your customer list

Have a CSV of locations? Know which addresses a storm could reach before it does: the county forecast status (A to F) for every row, 500 locations per call, written to a new CSV. Forecast risk, it could happen.

Powered by atlasunited.io

What other tools call this: a portfolio storm forecast. County-level; for address-level use ML Storm Forecast by Address.

POST/v1/portfolio/risk$0.05 per location
Your appPOST /v1/portfolio/risk
500 locations per call
TrueFixR APIScores forecast risk for each point
You get back
county status per location: A, B, C, D or F

What you get back

LocationsCallsCost
5001$25.00
1,2003$60.00
10,00020$500.00

Cost = locations x $0.05. The script prints this first and stops unless you add --go.

HTTP/2 402
{"x402Version":2, "error":"Payment required",
 "accepts":[{"scheme":"exact", "network":"eip155:8453", "amount":"50000", ...}], ...}

Real answer when you call without a key or payment (amount 50000 = $0.05 in atomic USDC). Nothing is charged. Add your key and it returns the statuses.

lat,lon,county,state,grade
30.0,-97.74,Travis,TX,A
30.001,-97.74,Travis,TX,B
30.002,-97.74,Travis,TX,C

Output CSV from our local mock server (a stand-in we wrote to prove the batching logic: 1,200 rows in, 3 calls of 500, 500, 200, 1,200 rows out). Grades here are dummy values. No paid call was made.

Copy and paste

python3 · requests
import csv, os, sys, requests

BASE = os.environ.get("TRUEFIXR_URL", "https://data.truefixr.com")
KEY = os.environ.get("TRUEFIXR_KEY", "")
PRICE, BATCH = 0.05, 500          # $ per location, max locations per call

src, dst = sys.argv[1], sys.argv[2]
rows = list(csv.DictReader(open(src)))   # needs columns: lat, lon (optional: label)
batches = [rows[i:i + BATCH] for i in range(0, len(rows), BATCH)]
print(f"{len(rows)} locations, {len(batches)} calls, cost ${len(rows) * PRICE:.2f}")
if "--go" not in sys.argv:
    sys.exit("Dry run. Add --go to make the paid calls.")

out = []
for b in batches:
    locs = [{"lat": float(r["lat"]), "lon": float(r["lon"]), "label": r.get("label", "")} for r in b]
    resp = requests.post(
        f"{BASE}/v1/portfolio/risk",
        json={"locations": locs, "window": "24h"},
        headers={"Authorization": f"Bearer {KEY}"} if KEY else {},
        timeout=60,
    )
    if resp.status_code == 402:
        sys.exit("402 Payment required: add TRUEFIXR_KEY (prepaid key) and a balance.")
    resp.raise_for_status()
    out += resp.json()["results"]

with open(dst, "w", newline="") as f:
    w = csv.DictWriter(f, fieldnames=["lat", "lon", "county", "state", "grade"], extrasaction="ignore")
    w.writeheader()
    w.writerows(out)
print(f"Wrote {len(out)} rows to {dst}")
Run it
terminal
export TRUEFIXR_KEY=your_api_key
python3 portfolio_scan.py locations.csv graded.csv          # dry run, prints cost
python3 portfolio_scan.py locations.csv graded.csv --go     # pays and runs

# locations.csv columns: label,lat,lon
1200 locations, 3 calls, cost $60.00
Dry run. Add --go to make the paid calls.

Real dry-run output. Same on the JavaScript version.

3

Build your own storm alerts for your list

Send your properties once. Get current weather, wind speed and any active severe alert for each one. Run it every 30 minutes and have your own script send the text or email. TrueFixR supplies the data; your tool sends the alert.

What other tools call this: storm tracking. You build the alert yourself.

POST/v1/weather/batch$0.0002 per location
Your appPOST /v1/weather/batch
[{label, lat, lon}, ...]
TrueFixR APICurrent conditions and alerts for each point
You get back
alerts: [ ] per location

What you get back

{
  "location": {"lat": 32.78, "lon": -96.80},
  "alerts": [],
  "nowcast": {"raining_now": false, ...},
  "temperature_f": 71.1,
  "wind_gust_mph": 12.2,
  "billed": false
}

Real free single-location call (GET /v1/data?dataset=weather). The batch route returns current conditions and active alerts for each location. In this free call, an empty alerts list means no active alert right now.

ALERT Dallas depot: {'event': 'Severe Thunderstorm Warning'}

Output from your own script against a local mock server we wrote. The alert text is made up for the test. Real alert objects come straight from the weather service.

Cost for 3 locations every 30 minutes for a day: 3 x 48 x $0.0002 = $0.03.

Copy and paste

python3 · requests
import os, requests

KEY = os.environ["TRUEFIXR_KEY"]
BASE = os.environ.get("TRUEFIXR_URL", "https://data.truefixr.com")
PROPERTIES = [
    {"label": "Austin office", "lat": 30.27, "lon": -97.74},
    {"label": "Dallas depot", "lat": 32.78, "lon": -96.80},
    {"label": "Waco yard", "lat": 31.55, "lon": -97.15},
]  # up to 500 per call, $0.0002 each

resp = requests.post(
    f"{BASE}/v1/weather/batch",
    json={"locations": PROPERTIES},
    headers={"Authorization": f"Bearer {KEY}"},
    timeout=60,
)
resp.raise_for_status()

for place in resp.json()["results"]:
    for alert in place.get("alerts", []):
        print(f"ALERT {place['label']}: {alert}")
Run it
terminal
export TRUEFIXR_KEY=your_api_key
python3 storm_alerts.py
Schedule it
terminal
# crontab -e   (every 30 minutes)
*/30 * * * * TRUEFIXR_KEY=your_api_key /usr/bin/python3 /path/to/storm_alerts.py >> alerts.log 2>&1
4

Property storm report card

One property in, one small HTML card out: its storm history by type plus the county forecast label. Drop it in a claims report, an email or a dashboard.

What other tools call this: a property storm history report or hail history report cover page.

GEThazard_score + addressFree previews, no key
Your appGET dataset=hazard_score
GET dataset=address
lat=32.78&lon=-96.80
TrueFixR APIStorm history by peril, plus the county forecast label
You get back
property_card.html

What you get back

Dallas County, TX

Forecast risk now: C Elevated risk

686 reported storm events, 2003-01-01 to present

flood141
hail127
winter119
wind110
extreme temp96

Real card, generated by the script below from the live free previews.

Want the most severe and most recent event per peril on the card? Add addresses=true to hazard_score: $0.50 per property.

Copy and paste

python3 · requests
import sys, html, requests

lat, lon = sys.argv[1:3]
get = lambda ds: requests.get("https://data.truefixr.com/v1/data",
                              params={"dataset": ds, "lat": lat, "lon": lon}, timeout=30).json()
score, addr = get("hazard_score"), get("address")

top = sorted(score["by_peril"].items(), key=lambda kv: -kv[1]["event_count"])[:5]
rows = "".join(f"<tr><td>{p.replace('_', ' ')}</td><td>{v['event_count']}</td></tr>" for p, v in top)
grade = addr["current_forecast_risk"]

open("property_card.html", "w").write(f"""<!doctype html><meta charset=utf-8>
<div style="font:16px system-ui;max-width:360px;border:1px solid #dfe7f2;border-radius:16px;padding:20px">
  <h2 style="margin:0">{html.escape(addr['county'].title())} County, {addr['state']}</h2>
  <p>Forecast risk now: <b>{grade['grade']}</b> ({html.escape(grade['grade_label'])})</p>
  <p>{score['total_events']} reported storm events, {score['report_period']}</p>
  <table>{rows}</table>
</div>""")
print("wrote property_card.html")
Run it
terminal
python3 property_card.py 32.78 -96.80
open property_card.html
# or: node property_card.mjs 32.78 -96.80
5

CRM enrichment

A small function that adds a storm event count and the county forecast label to any record that has a latitude and longitude.

What other tools call this: property storm history added to a customer record, or storm leads for your CRM.

GETdataset=addressFree preview, no key
Your appenrich({name, lat, lon})
TrueFixR APIOne call: history near the point plus the county forecast label
You get back
storm_event_count, risk_grade

What you get back

{'name': 'Acme Dallas',
 'lat': 32.78, 'lon': -96.8,
 'storm_event_count': 297,
 'risk_grade': 'C'}
{'name': 'Acme Charleston',
 'lat': 32.78, 'lon': -79.93,
 'storm_event_count': 37,
 'risk_grade': 'D'}

Real output against the live API. The free preview gives counts and the grade. The event records themselves are addresses=true, $0.05 per address.

Copy and paste

python3 · requests
import requests

def enrich(record):
    """Add storm_event_count and risk_grade to a dict that has lat and lon."""
    d = requests.get(
        "https://data.truefixr.com/v1/data",
        params={"dataset": "address", "lat": record["lat"], "lon": record["lon"]},
        timeout=30,
    ).json()
    record["storm_event_count"] = d.get("storm_event_count", 0)
    record["risk_grade"] = d.get("current_forecast_risk", {}).get("grade")
    return record

if __name__ == "__main__":
    for rec in [{"name": "Acme Dallas", "lat": 32.78, "lon": -96.80},
                {"name": "Acme Charleston", "lat": 32.78, "lon": -79.93}]:
        print(enrich(rec))
Run it
terminal
python3 enrich.py
# or: node enrich.mjs
6

An agent that pays per call

No account, no key. Your agent calls the API, gets a 402 with the price, pays in USDC on Base, and gets the data. A standard x402 client does the paying for you.

x402USDC on BaseSame prices as a key
Your appfetch(url)
TrueFixR APIReplies 402 with the price
You get back
pays, retries, gets the data

What you get back

HTTP/2 402
x402Version: 2
scheme:      exact
network:     eip155:8453  (Base)
amount:      50000        (USDC, 6 decimals = $0.05)
asset:       USD Coin

Real 402 from POST /v1/portfolio/risk, decoded from the payment-required header. Nothing was paid.

Copy and paste

javascript · example
import { wrapFetchWithPayment } from "x402-fetch";
import { privateKeyToAccount } from "viem/accounts";

const account = privateKeyToAccount(process.env.AGENT_KEY);
const payFetch = wrapFetchWithPayment(fetch, account);

const url = "https://data.truefixr.com/v1/data"
          + "?dataset=address&lat=32.78&lon=-96.80&addresses=true";
const res = await payFetch(url);   // pays $0.05 only if the server asks
console.log(await res.json());

Example only: fund the wallet with a little USDC on Base first. Full walkthrough, wallet setup and the manifest are on the For agents page.

What you can build

Your data. Your template. Your brand.

We sell the storm data. You decide how it looks. Everything comes back as JSON you can save, and lists also come as a CSV file with format=csv.

A storm report built from the data

A branded report

Your logo, your layout. Our data fills it in.

A spreadsheet

Storm facts in a column next to each customer.

A CRM field

Save storm history on every customer record.

Your own text or email alert

Check on a schedule, then send your own message when a storm is near.

A map

Drop every address on your own map.

A mobile app

Put a storm check in your team's pocket.

Use it in your own tools. We do not lock you into a report format.

Start free in 2 minutes.

No contract. Pay only for what you use.