For property managers, real estate and home services
Show storm facts on every property.
Buyers and tenants ask about storms. Answer on the page, for 5 cents per address.
Free to try. No contract. Pay only for what you use.


Plain money math
Property managers and real estate
Answer the storm question before it is asked. Fill the panel in for every address automatically.
How it works
Three steps. Same day.

Send the address
One call per property page.

Get the storm panel
Storm count, types and the county forecast label.

Show it on your page
In your own colors.
Not a developer? Start here
Just ask your AI.
Copy this into Claude or ChatGPT. It will show you how to add a storm panel to your own property listing or website, step by step.
Using the TrueFixR storm API (https://data.truefixr.com/llms.txt), show a storm panel on my property pages: storms reported nearby in the past year and the county forecast label A to F. My key: YOUR_KEY
Paste it into ChatGPT or Claude, swap in your address and your key.
More detail for your AI
I am not a programmer. I run a website with property pages and I want to show a storm panel on each one: how many storms were reported nearby in the past year, and the county forecast label (A to F, context only).

Base URL: https://data.truefixr.com
Docs: https://truefixr.com/docs.html
Free menu of everything the API offers: https://data.truefixr.com/v1/data
My API key is YOUR_KEY. Paid calls need the header Authorization: Bearer YOUR_KEY. Free previews need no key.

What to do: for a property's latitude and longitude, call
GET https://data.truefixr.com/v1/data?dataset=address&lat=[LAT]&lon=[LON]
The free preview returns storm_event_count, storm_types and current_forecast_risk (the county label: grade and grade_label). For the Storm History summary (a longer storm summary of one property by kind of storm), use dataset=hazard_score at $0.50 per property.

Please: (1) ask me what website tool I use (for example WordPress, Wix, Squarespace or custom), (2) give me a small snippet to paste in and tell me exactly where it goes, (3) show me how it looks with the sample point lat=32.78 lon=-96.80, (4) explain how to show it to visitors in plain words.

Rules for you:
- Always start with the free preview and tell me the exact price before any paid call. Never make a paid call without asking me first.
- If you cannot call web addresses yourself, give me the exact link to open in my browser and I will paste back what I see.
- Talk to me like I am not a programmer. Short steps, plain words, tell me exactly what to click or paste.
- These are reported and radar-detected storm events and forecast risk. They are not an inspection and not a damage assessment, so say so in your answer.
How to use it. 1. Press Copy. 2. Open Claude or ChatGPT and paste. 3. Swap YOUR_KEY for your key from Get started, or leave it and stay on the free previews.
What your users see
A property page with a storm panel.
Every number below came from a real free preview.
Sample point 32.78, -96.80
Dallas County, TX
Storm history
Forecast risk now
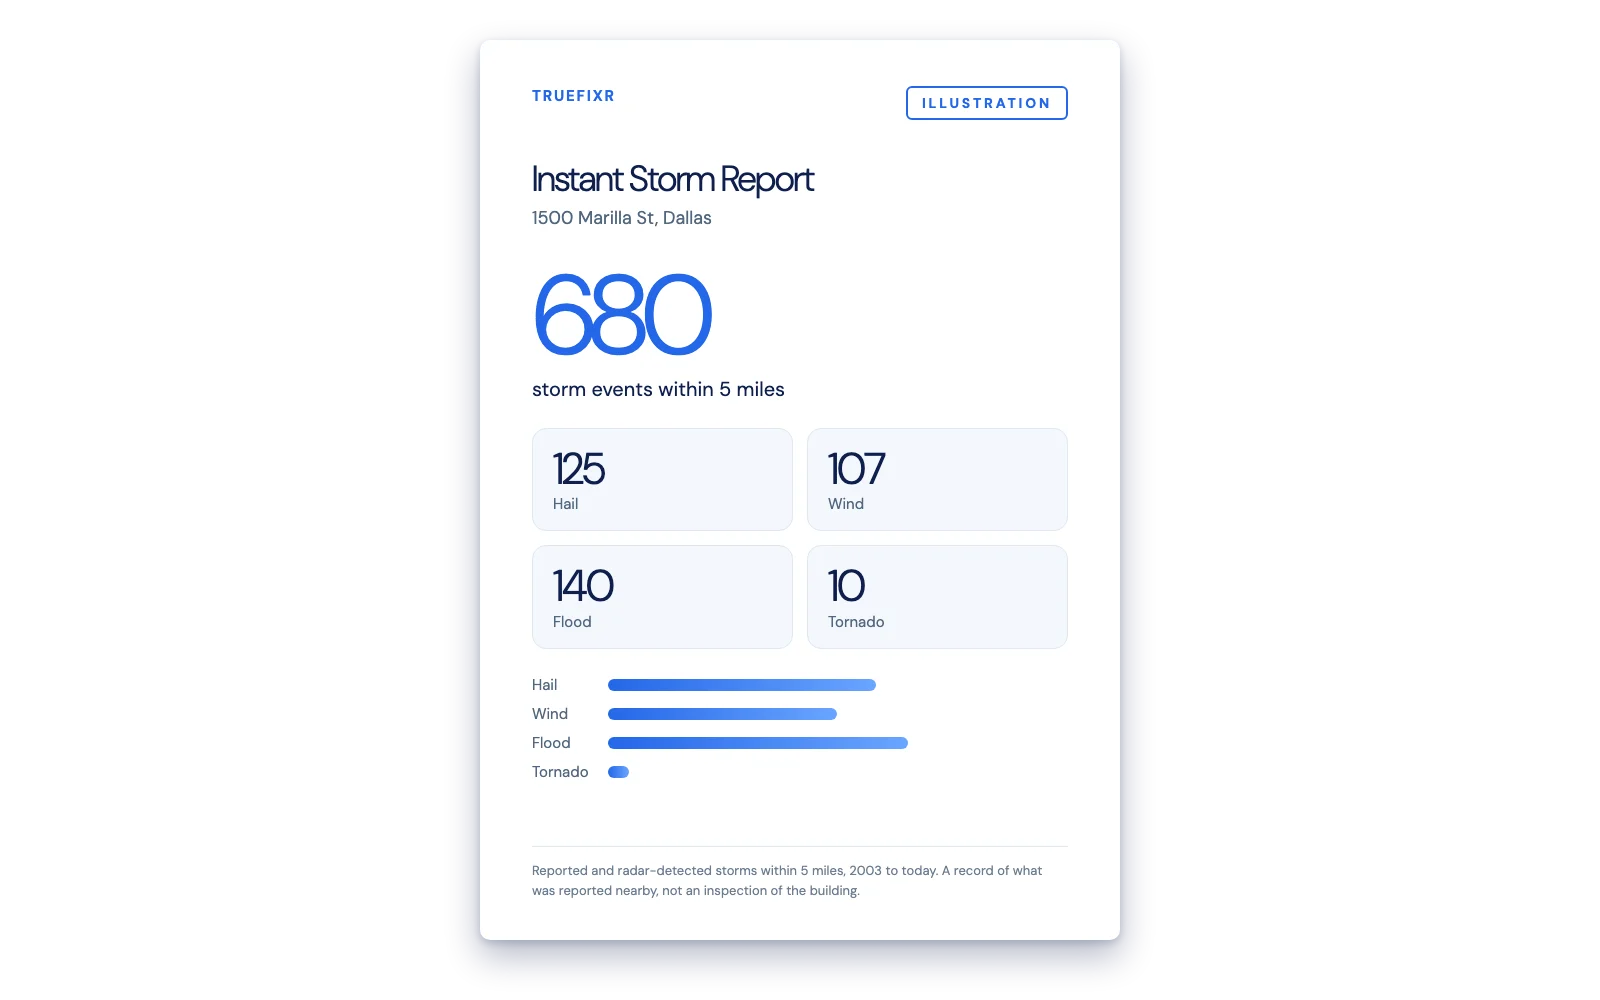
Property storm risk report: 686 events within 5 mi since 2003
Also in the response: tornado 10, lightning 6, wildfire 3, hurricane 0, coastal 0. Reported and radar-detected events. Not an inspection.
What the free preview gives you
Counts, ranges and the county forecast label. That is enough to build and test the whole panel with no key and no charge.
What the paid pull adds
- address, $0.05 per address: the actual storm event records behind the count.
- hazard_score (Storm History summary), $0.50 per property: for each peril, frequency, most severe event, most recent event and years since the last event.
Both free previews show the real price before you pay.
How it works
Address in. Storm panel out.
Your page sends the address. The panel fills itself in. Click the diagram to replay it.
GET /v1/data?dataset=address&lat=32.78&lon=-96.80{
"storm_event_count": 297,
"storm_types": {"HEAVY_RAIN": 297},
"current_forecast_risk": {
"grade": "C",
"grade_label": "Elevated risk"
}
}Have a developer?
Hand them this code.
It builds the panel from two free previews. No key needed to try it.
For developers: the code
import html, requests

API = "https://data.truefixr.com/v1/data"

def get(dataset, lat, lon):
    return requests.get(API, params={"dataset": dataset, "lat": lat, "lon": lon}, timeout=20).json()

def risk_card(lat, lon):
    a, h = get("address", lat, lon), get("hazard_score", lat, lon)
    top = sorted(h["by_peril"].items(), key=lambda kv: -kv[1]["event_count"])[:4]
    rows = "".join(f"<li>{html.escape(k)}: {v['event_count']}</li>" for k, v in top if v["event_count"])
    grade = a["current_forecast_risk"]
    return (f"<div class='risk'><b>{a['storm_event_count']} reported storm events nearby</b>"
            f"<p>Forecast risk: {grade['grade']} ({html.escape(grade['grade_label'])})</p><ul>{rows}</ul></div>")

print(risk_card(32.78, -96.80))const API = "https://data.truefixr.com/v1/data";
const get = (dataset, lat, lon) =>
fetch(`${API}?dataset=${dataset}&lat=${lat}&lon=${lon}`).then((r) => r.json());
async function riskCard(lat, lon) {
const [a, h] = await Promise.all([get("address", lat, lon), get("hazard_score", lat, lon)]);
const rows = Object.entries(h.by_peril)
.filter(([, v]) => v.event_count > 0)
.sort((x, y) => y[1].event_count - x[1].event_count)
.slice(0, 4)
.map(([k, v]) => `<li>${k}: ${v.event_count}</li>`)
.join("");
const g = a.current_forecast_risk;
return `<div class="risk"><b>${a.storm_event_count} reported storm events nearby</b>` +
`<p>Forecast risk: ${g.grade} (${g.grade_label})</p><ul>${rows}</ul></div>`;
}
riskCard(32.78, -96.80).then(console.log);Real output of the Python version:
<div class='risk'><b>297 reported storm events nearby</b><p>Forecast risk: C (Elevated risk)</p><ul><li>flood: 141</li><li>hail: 127</li><li>winter: 119</li><li>wind: 110</li></ul></div>
Add it to your site
A panel you can paste in.
Paste a short script and add one line with the location. It runs live right here.
For developers: the embeddable widget
// Drop-in widget: <div id="risk" data-lat="32.78" data-lon="-96.80"></div>
async function mountRisk(el) {
  const base = "https://data.truefixr.com/v1/data?lat=" + el.dataset.lat + "&lon=" + el.dataset.lon;
  const get = (d) => fetch(base + "&dataset=" + d).then((r) => r.json());
  const [a, h] = await Promise.all([get("address"), get("hazard_score")]);
  const esc = (s) => String(s).replace(/[&<>"]/g, (c) => "&#" + c.charCodeAt(0) + ";");
  const perils = Object.entries(h.by_peril)
    .filter(([, v]) => v.event_count > 0)
    .sort((x, y) => y[1].event_count - x[1].event_count)
    .slice(0, 4)
    .map(([k, v]) => "<li>" + esc(k.replace("_", " ")) + ": " + v.event_count + "</li>")
    .join("");
  const g = a.current_forecast_risk || {};
  el.innerHTML =
    '<div style="font:14px system-ui;border:1px solid #dfe7f2;border-radius:12px;padding:16px;max-width:340px">' +
    "<b>Storm history</b><div>" + a.storm_event_count + " reported and radar-detected events nearby</div>" +
    "<div>Forecast risk: " + esc(g.grade || "n/a") + " (" + esc(g.grade_label || "") + ")</div>" +
    "<div style='margin-top:8px'>Events since 2003 by peril</div><ul>" + perils + "</ul>" +
    "<small>Forecast risk means it could happen. Not an inspection.</small></div>";
}
document.querySelectorAll("[data-lat]").forEach(mountRisk);That card is the widget above, running on this page against the live API.
How to start
Three steps. Same day.
Try the free previews
Use the free previews to build your panel with real answers. No key, no cost.
Render the card
Use the code above, or paste the ready-made panel. Show the storm count, the county forecast label and the main storm types.
Add a balance for full records
Top up a prepaid balance. Full records are $0.05 per address, or $0.50 per property for the Storm History summary.
What you can build
Your data. Your template. Your brand.
We sell the storm data. You decide how it looks. Everything comes back as JSON you can save, and lists also come as a CSV file with format=csv.
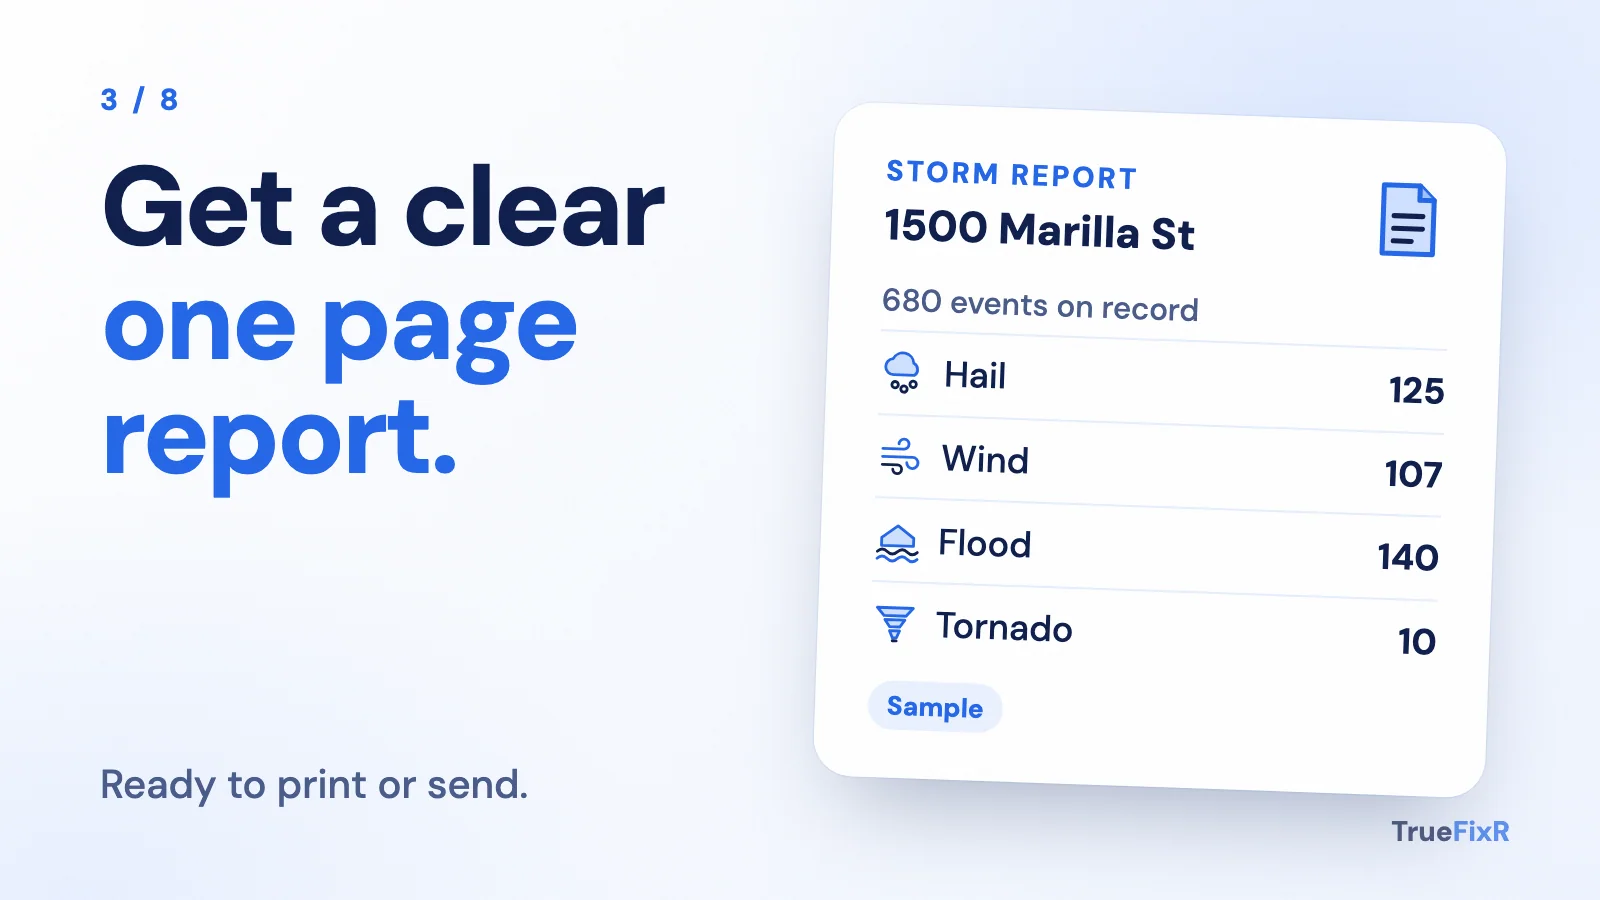
A branded report
Your logo, your layout. Our data fills it in.
A spreadsheet
Storm facts in a column next to each customer.

A CRM field
Save storm history on every customer record.

Your own text or email alert
Check on a schedule, then send your own message when a storm is near.
A map
Drop every address on your own map.

A mobile app
Put a storm check in your team's pocket.
Use it in your own tools. We do not lock you into a report format.
Start free in 2 minutes. No contract.
Try the free preview first. Add money to your balance only when you want the full answer. You pay only for what you use.
- Free previews
- No contract
- Pay only for what you use